169 Ways to Showdown
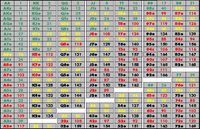
 The chart at the left is a fairly useless, though somewhat interesting piece of trivia I picked up some time ago that ranks all 169 starting hands in hold ’em. (Click the chart to enlarge.) The color-coding indicates whether a hand is ranked in the top 25% (green), the second 25% (yellow), the next 25% (red), or the bottom 25% (black). I suppose the colors could be read as indicating whether to “go” or “use caution” or “stop” or whatever.
 I’m afraid I’ve lost track of the source of this here information. I do recall that the rankings come from a computer simulation, not actual play, which involved dealing a 100,000 or 1 million hands (or something) to a ten-handed table and then showing down all ten to see which hand came out the winner -- an occurrence that might well have never happened a single time in all of the billions of hands of hold ’em ever played on the planet. That is to say, these rankings are strictly theoretical and not based on actual play. (I have seen attempts to produce hand rankings that were based on hands that were really, truly played; for example, here’s a fairly popular chart I’ve seen posted in more than one place.)
The only time I can see this chart ever being of any real value is in a no-limit tourney where you are heads-up and deciding whether or not to push all-in or call an all-in bet. Since you know you’re going to show down the hand, you might check to see how your hand rates (e.g., is it a “green” or “yellow” hand and thus above average?) as a way of helping you make your decision. As with all mechanically-derived decision-making solutions, though, I imagine doing this would likely cause more harm than help. (For another, more useful heads-up strategy that also focuses on the all-in decision, see Lee Jones’s article about his SAGE system in CardPlayer.)
Anyhow, stumbling across this chart again got me thinking about Poker Tracker and all of the data it contains. I purchased the program a couple of months ago, and have now entered all of the hold ’em hands I've played since January 1. Like a dutiful detective, I started snoopin’ around the numbers a bit and uncovered a few items of interest. Don’t know yet, really, how having this information around is helping my game at present. It does satisfy a few curiosities, at least.
I have now entered a total of 52,483 hands into this little monster. The great majority of the hands are from limit hold ’em, and two-thirds of those are at 6-max tables. I’m not going to get into precise numbers, but I will say that this particular sample demonstrates I’ve been a winning player. I mention that to provide a context of sorts for some of what follows -- obviously some of these stats would come out differently had I been only breaking even or losing at a high clip.
In those 52,483 hands, I have, unsurprisingly, been dealt all 169 possible starting combinations (between 100-500 times each). And -- perhaps more surprisingly -- I have “VP$IP” (voluntarily put money in the pot) for all 169. At least six times each, it appears. That’s right. I’ve willingly pursued 72-offsuit on multiple occasions. (There are lots of ways Poker Tracker can humble one, PDQ.)
I wondered if I had been dealt aces my fair share of times. I discovered I’d gotten AA a total of 223 times, a little less than the 1 in 221 the math says I am supposed to (more like 1 in 235 or so). In fact, of all 13 pairs AA is the one I’ve been dealt least often, although really the difference between my getting AA and 44 (266 times, my most frequently-drawn pocket pair) is pretty negligible. Overall I’m getting pairs just about exactly as often as I should -- 3156 times or once every 16.62 hands (slightly better, in fact, than the 1 in 17 that I should be expecting). This fact might be read as an indication that the shuffling software on the sites where I play the most (PokerStars, PartyPoker, and Full Tilt Poker) seems to be in order, not that I doubted it. It won’t satisfy the “RiverStars” conspiracy theorists, though. Nothing would.
How often do I win with AA? About 80% of the time, by far the highest percentage of all 169 hands. I’m getting the highest BB/100 rate with AA as well, considerably above the second-best hand (KK). Interestingly, of all 169 hands there are only 11 hands where my win % is above 50%: AA, KK, JJ, AQs, AKs, QQ, AKo, AJs, TT, AQo, KQs. Notice that 10 of these 11 hands are rated as top 11 hands in the chart. AQo, my 10th-best hand, is rated 18th; KJs, which the simulation ranked 9th, is only my 20th-best hand in terms of winning percentage. (Of course, I could well be playing KJs like a donk.) The small number of +50% winners confirms what most of us already know -- most hands simply aren’t going to prove winners, no matter how good a player you are.
I also learned that winning percentage isn’t necessarily related to making a profit. Scanning down the list of hands I see some glaring examples of such incongruity. I only win 14% of the hands when dealt J4-suited, yet I’m scooping the same number of BB/hand with that hand as I am when dealt a pair of sevens (a hand that wins 40% of the time). In fact, when I look at the “W$SD” column (wins money at showdown), J4-suited is the third-best hand, winning 72% of the time when I show it down.
How can this be? Thinking about it a bit, I realize a stat like this makes sense. I might be a bit jingle-brained, but I’m not insane, so I’m not showing down shinola like J4s unless I’m a likely winner. Same goes for 73-suited, which proudly sits atop the W$SD list at 89%. Closer inspection reveals why that percentage is so high. I’ve been dealt 73-suited 154 times. Only 21 times did I actually play the hand, and 20 of those 21 were from the blinds. (Once, I called from the button with 73s and -- predictably -- lost the hand before the showdown.) Of those 21 hands, I ended up going to showdowns 9 times total (seems like a lot), winning three times with flushes, twice with a pair of sevens, once with a straight, once with two pair, and once with a pair of threes. 8 of 9 showdowns comes out to 89%. (I should add that all 8 of these wins were at 6-max tables, where such crap is marginally more likely to hold up than at a full table.)
One last observation here about starting hands and limit hold ’em. You might notice how on the chart the suited hands generally rank much higher than their non-suited counterparts. For instance, A6-suited is rated the 34th best hand, whereas A6-offsuit is a crummy 113th. Looking at Poker Tracker, it seems this truth is borne out in practice. Again and again and again. The biggest losers (in terms of winning percentage) are almost all non-suited hands -- 37 out of the bottom 40, in fact. Also, in every single case I’ve won more often with the suited version of a hand than with the same hand, non-suited. That’s every time -- all 78 pairs of suited/non-suited starting hands! Sometimes the difference is enormous. For example, K8-suited wins three times as often as K8-offsuit; K5-suited wins four times as often as K5o. With all of those popular “suited connectors” (JTs through 54s), I'm doing much better than with their offsuit counterparts -- again, usually 3 to 4 times better. So I’m inclined to distrust those who claim suitedness is an overrated factor, particularly if you’re playing limit hold ’em.
If you’ve read this far, you must be at least a little intrigued by the numbers of poker and/or Poker Tracker and/or silly charts like the one posted above. If you are, let me know if any of my observations seem off-base or the result of my own idiosyncracies. I’m also interested to hear about how others are using Poker Tracker and whether (and how) it is beneficial to them.
Enough numbers, sheesh. The likelihood that the next post will not involve math in any way is well above 95%, I’d say.
Labels: *shots in the dark, Lee Jones, limit hold'em, Poker Tracker, SAGE, starting hand charts


4 Comments:
Dude, I know this is a comment coming in on an old blog entry, but.. had to just shout. Nice job... I'll bookmark you and be back....
StregaChess
Thanks, Strega! Much appreciated.
Great post! I'm kind of a new player, and it's exactly the information I was looking for, not just numbers on a piece of paper. I didn't go through all you blog, but have you make an update on those numbers since 2006? Or found out any other interesting facts?
Thanks, Monsieur 7. I actually got away from using PokerTracker there for a good while from early 07-late 08 as I was mostly playing PLO. However, starting with the new year I've moved back over to limit hold'em and am once again looking at my stats & how starting hands are playing & so forth. Might be time soon to do a new post like this one & revisit some of this.
I had one other post in December '06 you might be interested in called "Check Your Filters Regularly" where I got into some other PokerTracker stuff.
Post a Comment
<< Home